When the US Treasury buys back long-term bonds, it changes the debt investors hold. In August, Treasury announced an expansion of these purchases to improve trading in older securities.1 The question is how much those purchases can also change the government's long-term borrowing costs. The first operations show how much Treasury bought, but reading their effect from the yield curve is more difficult: the curve flattened even though long-term US yields rose.
The purchases behind this comparison had a total principal value of $15.3 billion. Treasury bought these longer-term bonds through three nominal-coupon operations between September 2 and October 1, 2026. This amount only tells us what the securities promise to repay, not necessarily the cash Treasury actually paid. The subtotal covers the 10–30-year maturity range and excludes TIPS and shorter-maturity operations: $5.187 billion of 10–20-year debt on September 10, $4.078 billion of 20–30-year debt on September 24, and $6 billion of 10–20-year debt on October 1.2 These records show how much Treasury bought, but establishing how much those purchases changed yields requires more than the purchase total.
One link to yields runs through the interest-rate exposure held by private investors. Buying back long-term debt can reduce that exposure. That reduction, however, depends on how the Treasury finances the purchase: it can draw down cash balances or issue replacement debt. If Treasury issues replacement debt, the maturity of that debt determines how much exposure returns to the market. Financing the purchase with bills can shorten the exposure investors hold, meaning the financing choice is part of the same mechanism as the purchase. The actual duration of the purchased bonds and their replacement financing are unmeasured here, so the gross total cannot establish how much exposure Treasury removed overall.
That dependence on fiscal financing also explains why Treasury buybacks differ from Fed asset purchases. The Fed creates reserves to buy assets, while Treasury uses fiscal cash and borrowing, so the reserve consequences depend on how the purchases are financed. A finite Treasury program also carries no commitment to defend a particular yield. Even though buying back bonds can change the risk investors hold, the purchases alone cannot establish how large or persistent the market response will be.
Treasury's stated objective, however, concerns trading in off-the-run debt, meaning older securities that are generally less liquid than current benchmarks. Its August 19 announcement increased nominal long-end liquidity-support operations starting September 9.1 These purchases could ease dealers' inventory constraints and change the prices of individual securities relative to neighboring issues. Such improvements in trading can coexist with changes in interest-rate exposure, but measuring them requires neighboring price and liquidity histories that are absent from this analysis.
Market Note · Treasury Buybacks · 2026
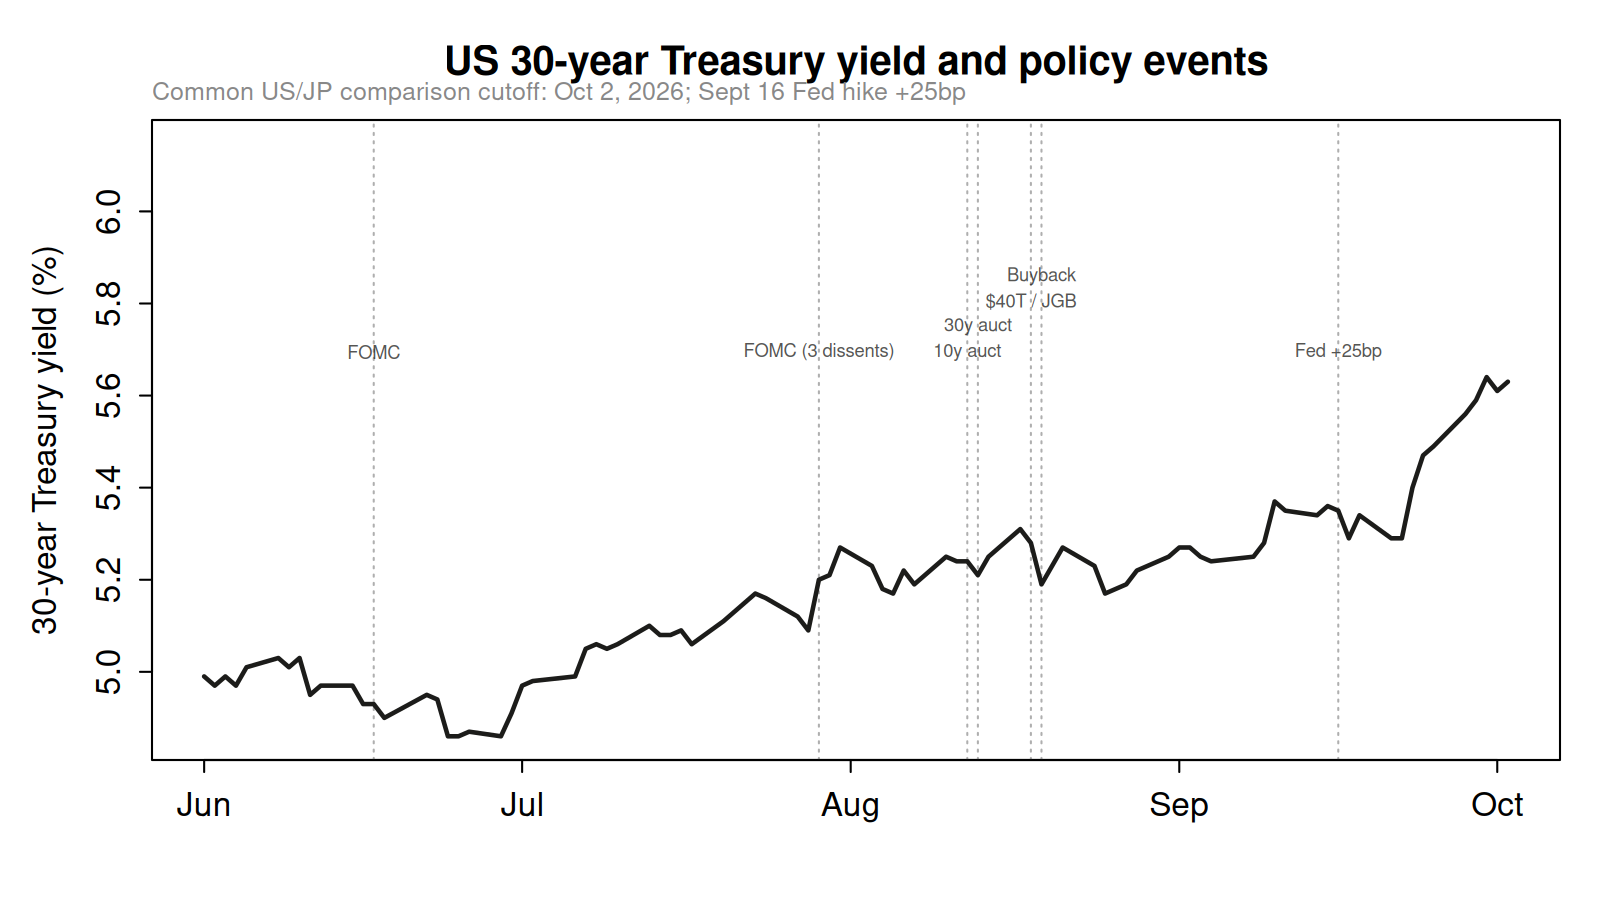
US 30-year Treasury yield and policy events
30-year Treasury yield; common US/JP comparison cutoff Oct 2, 2026
Ten dates common to US and Japan in each window, 2026.
All chart data
- Jun 1, 2026: 30-year yield: 4.99 %
- Jun 2, 2026: 30-year yield: 4.97 %
- Jun 3, 2026: 30-year yield: 4.99 %
- Jun 4, 2026: 30-year yield: 4.97 %
- Jun 5, 2026: 30-year yield: 5.01 %
- Jun 8, 2026: 30-year yield: 5.03 %
- Jun 9, 2026: 30-year yield: 5.01 %
- Jun 10, 2026: 30-year yield: 5.03 %
- Jun 11, 2026: 30-year yield: 4.95 %
- Jun 12, 2026: 30-year yield: 4.97 %
- Jun 15, 2026: 30-year yield: 4.97 %
- Jun 16, 2026: 30-year yield: 4.93 %
- Jun 17, 2026: 30-year yield: 4.93 %
- Jun 18, 2026: 30-year yield: 4.90 %
- Jun 22, 2026: 30-year yield: 4.95 %
- Jun 23, 2026: 30-year yield: 4.94 %
- Jun 24, 2026: 30-year yield: 4.86 %
- Jun 25, 2026: 30-year yield: 4.86 %
- Jun 26, 2026: 30-year yield: 4.87 %
- Jun 29, 2026: 30-year yield: 4.86 %
- Jun 30, 2026: 30-year yield: 4.91 %
- Jul 1, 2026: 30-year yield: 4.97 %
- Jul 2, 2026: 30-year yield: 4.98 %
- Jul 6, 2026: 30-year yield: 4.99 %
- Jul 7, 2026: 30-year yield: 5.05 %
- Jul 8, 2026: 30-year yield: 5.06 %
- Jul 9, 2026: 30-year yield: 5.05 %
- Jul 10, 2026: 30-year yield: 5.06 %
- Jul 13, 2026: 30-year yield: 5.10 %
- Jul 14, 2026: 30-year yield: 5.08 %
- Jul 15, 2026: 30-year yield: 5.08 %
- Jul 16, 2026: 30-year yield: 5.09 %
- Jul 17, 2026: 30-year yield: 5.06 %
- Jul 20, 2026: 30-year yield: 5.11 %
- Jul 21, 2026: 30-year yield: 5.13 %
- Jul 22, 2026: 30-year yield: 5.15 %
- Jul 23, 2026: 30-year yield: 5.17 %
- Jul 24, 2026: 30-year yield: 5.16 %
- Jul 27, 2026: 30-year yield: 5.12 %
- Jul 28, 2026: 30-year yield: 5.09 %
- Jul 29, 2026: 30-year yield: 5.20 %
- Jul 30, 2026: 30-year yield: 5.21 %
- Jul 31, 2026: 30-year yield: 5.27 %
- Aug 3, 2026: 30-year yield: 5.23 %
- Aug 4, 2026: 30-year yield: 5.18 %
- Aug 5, 2026: 30-year yield: 5.17 %
- Aug 6, 2026: 30-year yield: 5.22 %
- Aug 7, 2026: 30-year yield: 5.19 %
- Aug 10, 2026: 30-year yield: 5.25 %
- Aug 11, 2026: 30-year yield: 5.24 %
- Aug 12, 2026: 30-year yield: 5.24 %
- Aug 13, 2026: 30-year yield: 5.21 %
- Aug 14, 2026: 30-year yield: 5.25 %
- Aug 17, 2026: 30-year yield: 5.31 %
- Aug 18, 2026: 30-year yield: 5.28 %
- Aug 19, 2026: 30-year yield: 5.19 %
- Aug 20, 2026: 30-year yield: 5.23 %
- Aug 21, 2026: 30-year yield: 5.27 %
- Aug 24, 2026: 30-year yield: 5.23 %
- Aug 25, 2026: 30-year yield: 5.17 %
- Aug 26, 2026: 30-year yield: 5.18 %
- Aug 27, 2026: 30-year yield: 5.19 %
- Aug 28, 2026: 30-year yield: 5.22 %
- Aug 31, 2026: 30-year yield: 5.25 %
- Sep 1, 2026: 30-year yield: 5.27 %
- Sep 2, 2026: 30-year yield: 5.27 %
- Sep 3, 2026: 30-year yield: 5.25 %
- Sep 4, 2026: 30-year yield: 5.24 %
- Sep 8, 2026: 30-year yield: 5.25 %
- Sep 9, 2026: 30-year yield: 5.28 %
- Sep 10, 2026: 30-year yield: 5.37 %
- Sep 11, 2026: 30-year yield: 5.35 %
- Sep 14, 2026: 30-year yield: 5.34 %
- Sep 15, 2026: 30-year yield: 5.36 %
- Sep 16, 2026: 30-year yield: 5.35 %
- Sep 17, 2026: 30-year yield: 5.29 %
- Sep 18, 2026: 30-year yield: 5.34 %
- Sep 21, 2026: 30-year yield: 5.29 %
- Sep 22, 2026: 30-year yield: 5.29 %
- Sep 23, 2026: 30-year yield: 5.40 %
- Sep 24, 2026: 30-year yield: 5.47 %
- Sep 25, 2026: 30-year yield: 5.49 %
- Sep 28, 2026: 30-year yield: 5.56 %
- Sep 29, 2026: 30-year yield: 5.59 %
- Sep 30, 2026: 30-year yield: 5.64 %
- Oct 1, 2026: 30-year yield: 5.61 %
- Oct 2, 2026: 30-year yield: 5.63 %
Event markers: full labels
- Jun 17, 2026: FOMC
- Jul 29, 2026: FOMC (3 dissents)
- Aug 12, 2026: 10y auction
- Aug 13, 2026: 30y auction
- Aug 18, 2026: $40T / JGB
- Aug 19, 2026: Buyback
- Sep 16, 2026: Fed +25bp
Figure 1. The August 19 marker denotes the announcement of expanded nominal long-end liquidity-support operations. Implementation began September 9; the first purchase in the selected maturity range occurred September 10.
Beyond these security-level trading effects, the financing mechanism is also examined from the issuance side in Stephen Miran and Nouriel Roubini's July 2024 study of activist Treasury issuance. Issuing more bills relative to coupons can reduce the duration exposure investors hold, regardless of which administration chooses that financing mix. This can affect the term premium, the compensation investors require for the risks of holding long-term bonds. Expected short rates are a separate part of yields, so a change in the term premium need not determine the direction of the whole yield.
Their study's Table 2 compares actual issuance with an 18% bill-share benchmark, under which coupon principal would have been $813 billion higher. The authors' literature-based estimates put the term premium 14–40bp below that benchmark, with a central estimate of 25bp.3 These estimates concern a different change in government borrowing. They establish neither a buyback-effect estimate nor a coefficient per dollar of ten-year-equivalent exposure.
Transferring those estimates to these purchases would require a comparable measure of interest-rate exposure on both sides of the calculation. The $813 billion measures coupon principal, while a duration adjustment to the buybacks would express their principal in ten-year equivalents. Applying a principal-based ratio to those equivalents leaves the reference portfolio's exposure unspecified. With that normalization and the actual replacement financing unresolved, the purchase total supplies no defensible numerical estimate or upper bound for the yield response.
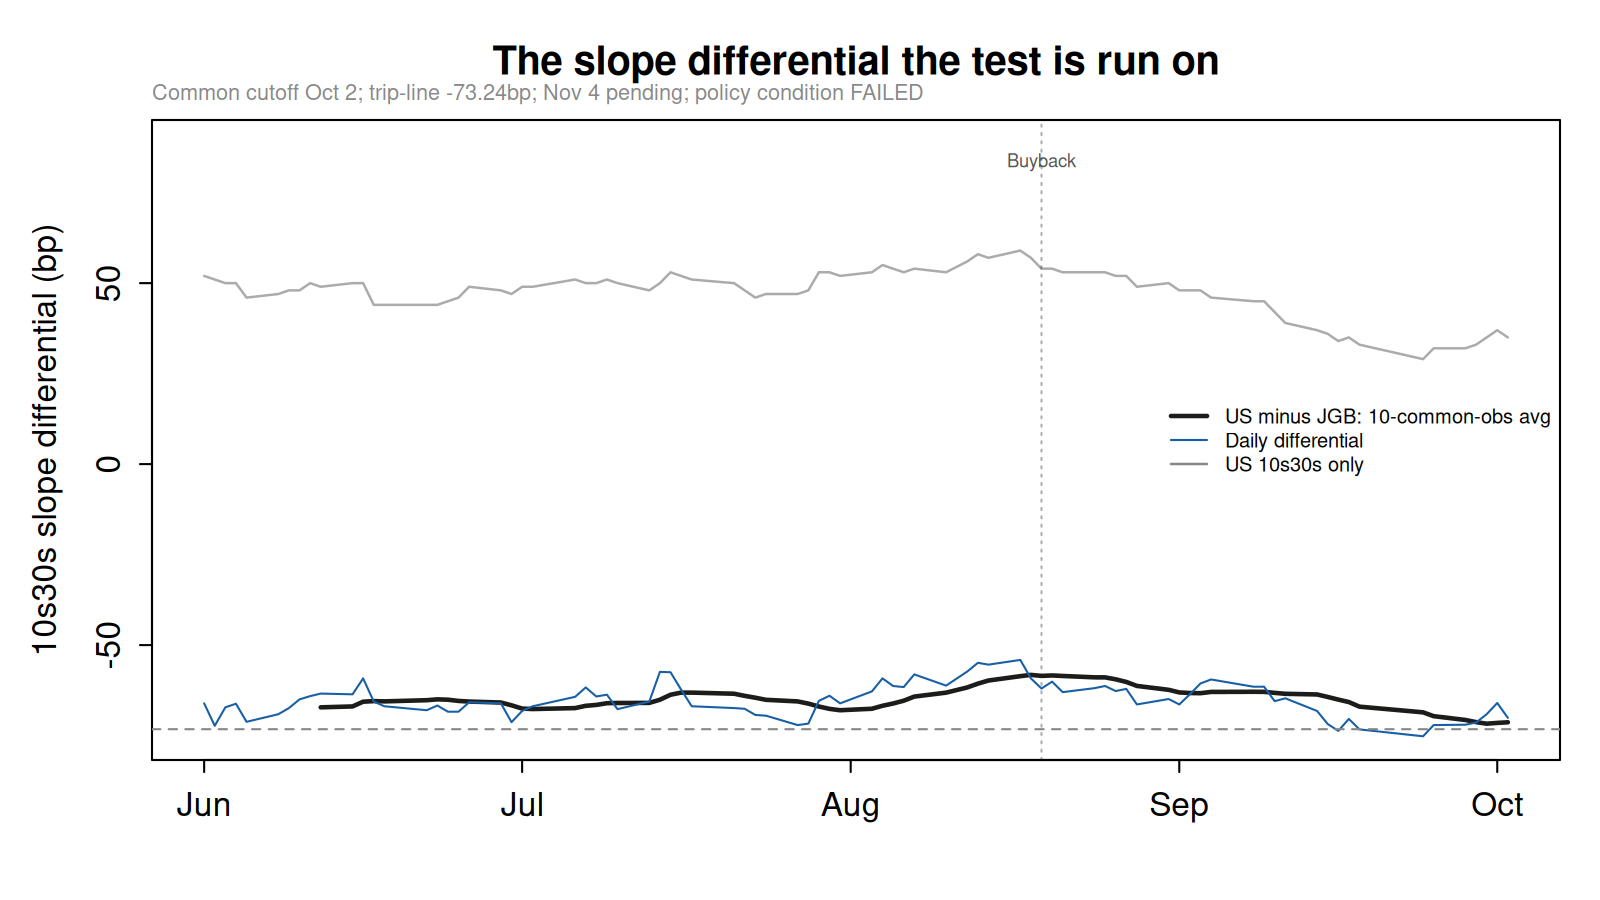
The yield data show how the curve changed between the baseline and later observation windows. Comparing the gap between US 30-year and 10-year yields with the same gap in Japan shows that the US gap narrowed relative to Japan's. The average measure shows a narrowing of 8.1bp between the windows ending September 2 and October 2: the US-minus-Japan differential moved from −63.24bp to −71.33bp.4 Each average uses ten dates common to both countries, August 20–September 2 for the baseline and September 16–October 2 for the latest window. The US slope narrowed from 51.20bp to 33.50bp, while Japan's narrowed from 114.44bp to 104.83bp. While these numbers show what changed, they do not establish how much of that change Treasury's purchases caused.
Alongside this relative narrowing, the US 30-year yield was also higher in the later window. Its average rose from 5.23% to 5.50%, an increase of 26.9bp before rounding.4 The curve flattened because the 10-year yield rose more than the 30-year yield. The comparison provides no basis for confidence in the original negligible-buyback-response thesis, because it cannot identify the buyback response. The relative flattening neither disproves that thesis nor establishes an outright fall in long-term borrowing costs.
Market Note · Treasury Buybacks · 2026
The slope differential the test is run on
10-common-observation average; trip-line -73.24bp; Nov 4 pending; policy condition failed (Sept 16 hike)
Ten dates common to US and Japan in each window, 2026.
All chart data
- Jun 1, 2026: US-minus-JGB 10s30s: Not available; Daily US-minus-JGB: -66.10 bp; US 10s30s only: 52.00 bp
- Jun 2, 2026: US-minus-JGB 10s30s: Not available; Daily US-minus-JGB: -72.30 bp; US 10s30s only: 51.00 bp
- Jun 3, 2026: US-minus-JGB 10s30s: Not available; Daily US-minus-JGB: -67.20 bp; US 10s30s only: 50.00 bp
- Jun 4, 2026: US-minus-JGB 10s30s: Not available; Daily US-minus-JGB: -66.20 bp; US 10s30s only: 50.00 bp
- Jun 5, 2026: US-minus-JGB 10s30s: Not available; Daily US-minus-JGB: -71.20 bp; US 10s30s only: 46.00 bp
- Jun 8, 2026: US-minus-JGB 10s30s: Not available; Daily US-minus-JGB: -69.10 bp; US 10s30s only: 47.00 bp
- Jun 9, 2026: US-minus-JGB 10s30s: Not available; Daily US-minus-JGB: -67.40 bp; US 10s30s only: 48.00 bp
- Jun 10, 2026: US-minus-JGB 10s30s: Not available; Daily US-minus-JGB: -65.00 bp; US 10s30s only: 48.00 bp
- Jun 11, 2026: US-minus-JGB 10s30s: Not available; Daily US-minus-JGB: -64.10 bp; US 10s30s only: 50.00 bp
- Jun 12, 2026: US-minus-JGB 10s30s: -67.20 bp; Daily US-minus-JGB: -63.40 bp; US 10s30s only: 49.00 bp
- Jun 15, 2026: US-minus-JGB 10s30s: -66.95 bp; Daily US-minus-JGB: -63.60 bp; US 10s30s only: 50.00 bp
- Jun 16, 2026: US-minus-JGB 10s30s: -65.64 bp; Daily US-minus-JGB: -59.20 bp; US 10s30s only: 50.00 bp
- Jun 17, 2026: US-minus-JGB 10s30s: -65.48 bp; Daily US-minus-JGB: -65.60 bp; US 10s30s only: 44.00 bp
- Jun 18, 2026: US-minus-JGB 10s30s: -65.55 bp; Daily US-minus-JGB: -66.90 bp; US 10s30s only: 44.00 bp
- Jun 22, 2026: US-minus-JGB 10s30s: -65.23 bp; Daily US-minus-JGB: -68.00 bp; US 10s30s only: 44.00 bp
- Jun 23, 2026: US-minus-JGB 10s30s: -64.99 bp; Daily US-minus-JGB: -66.70 bp; US 10s30s only: 44.00 bp
- Jun 24, 2026: US-minus-JGB 10s30s: -65.09 bp; Daily US-minus-JGB: -68.40 bp; US 10s30s only: 45.00 bp
- Jun 25, 2026: US-minus-JGB 10s30s: -65.43 bp; Daily US-minus-JGB: -68.40 bp; US 10s30s only: 46.00 bp
- Jun 26, 2026: US-minus-JGB 10s30s: -65.60 bp; Daily US-minus-JGB: -65.80 bp; US 10s30s only: 49.00 bp
- Jun 29, 2026: US-minus-JGB 10s30s: -65.87 bp; Daily US-minus-JGB: -66.10 bp; US 10s30s only: 48.00 bp
- Jun 30, 2026: US-minus-JGB 10s30s: -66.64 bp; Daily US-minus-JGB: -71.30 bp; US 10s30s only: 47.00 bp
- Jul 1, 2026: US-minus-JGB 10s30s: -67.54 bp; Daily US-minus-JGB: -68.20 bp; US 10s30s only: 49.00 bp
- Jul 2, 2026: US-minus-JGB 10s30s: -67.67 bp; Daily US-minus-JGB: -66.90 bp; US 10s30s only: 49.00 bp
- Jul 6, 2026: US-minus-JGB 10s30s: -67.41 bp; Daily US-minus-JGB: -64.30 bp; US 10s30s only: 51.00 bp
- Jul 7, 2026: US-minus-JGB 10s30s: -66.78 bp; Daily US-minus-JGB: -61.70 bp; US 10s30s only: 50.00 bp
- Jul 8, 2026: US-minus-JGB 10s30s: -66.53 bp; Daily US-minus-JGB: -64.20 bp; US 10s30s only: 50.00 bp
- Jul 9, 2026: US-minus-JGB 10s30s: -66.06 bp; Daily US-minus-JGB: -63.70 bp; US 10s30s only: 51.00 bp
- Jul 10, 2026: US-minus-JGB 10s30s: -65.99 bp; Daily US-minus-JGB: -67.70 bp; US 10s30s only: 50.00 bp
- Jul 13, 2026: US-minus-JGB 10s30s: -65.97 bp; Daily US-minus-JGB: -65.60 bp; US 10s30s only: 48.00 bp
- Jul 14, 2026: US-minus-JGB 10s30s: -65.10 bp; Daily US-minus-JGB: -57.40 bp; US 10s30s only: 50.00 bp
- Jul 15, 2026: US-minus-JGB 10s30s: -63.72 bp; Daily US-minus-JGB: -57.50 bp; US 10s30s only: 53.00 bp
- Jul 16, 2026: US-minus-JGB 10s30s: -63.13 bp; Daily US-minus-JGB: -62.30 bp; US 10s30s only: 52.00 bp
- Jul 17, 2026: US-minus-JGB 10s30s: -63.13 bp; Daily US-minus-JGB: -66.90 bp; US 10s30s only: 51.00 bp
- Jul 21, 2026: US-minus-JGB 10s30s: -63.44 bp; Daily US-minus-JGB: -67.40 bp; US 10s30s only: 50.00 bp
- Jul 22, 2026: US-minus-JGB 10s30s: -64.03 bp; Daily US-minus-JGB: -67.60 bp; US 10s30s only: 48.00 bp
- Jul 23, 2026: US-minus-JGB 10s30s: -64.54 bp; Daily US-minus-JGB: -69.30 bp; US 10s30s only: 46.00 bp
- Jul 24, 2026: US-minus-JGB 10s30s: -65.12 bp; Daily US-minus-JGB: -69.50 bp; US 10s30s only: 47.00 bp
- Jul 27, 2026: US-minus-JGB 10s30s: -65.56 bp; Daily US-minus-JGB: -72.10 bp; US 10s30s only: 47.00 bp
- Jul 28, 2026: US-minus-JGB 10s30s: -66.17 bp; Daily US-minus-JGB: -71.70 bp; US 10s30s only: 48.00 bp
- Jul 29, 2026: US-minus-JGB 10s30s: -66.97 bp; Daily US-minus-JGB: -65.40 bp; US 10s30s only: 53.00 bp
- Jul 30, 2026: US-minus-JGB 10s30s: -67.62 bp; Daily US-minus-JGB: -64.00 bp; US 10s30s only: 53.00 bp
- Jul 31, 2026: US-minus-JGB 10s30s: -68.00 bp; Daily US-minus-JGB: -66.10 bp; US 10s30s only: 52.00 bp
- Aug 3, 2026: US-minus-JGB 10s30s: -67.59 bp; Daily US-minus-JGB: -62.80 bp; US 10s30s only: 53.00 bp
- Aug 4, 2026: US-minus-JGB 10s30s: -66.77 bp; Daily US-minus-JGB: -59.20 bp; US 10s30s only: 55.00 bp
- Aug 5, 2026: US-minus-JGB 10s30s: -66.14 bp; Daily US-minus-JGB: -61.30 bp; US 10s30s only: 54.00 bp
- Aug 6, 2026: US-minus-JGB 10s30s: -65.37 bp; Daily US-minus-JGB: -61.60 bp; US 10s30s only: 53.00 bp
- Aug 7, 2026: US-minus-JGB 10s30s: -64.23 bp; Daily US-minus-JGB: -58.10 bp; US 10s30s only: 54.00 bp
- Aug 10, 2026: US-minus-JGB 10s30s: -63.14 bp; Daily US-minus-JGB: -61.20 bp; US 10s30s only: 53.00 bp
- Aug 12, 2026: US-minus-JGB 10s30s: -61.70 bp; Daily US-minus-JGB: -57.30 bp; US 10s30s only: 56.00 bp
- Aug 13, 2026: US-minus-JGB 10s30s: -60.65 bp; Daily US-minus-JGB: -54.90 bp; US 10s30s only: 58.00 bp
- Aug 14, 2026: US-minus-JGB 10s30s: -59.79 bp; Daily US-minus-JGB: -55.40 bp; US 10s30s only: 57.00 bp
- Aug 17, 2026: US-minus-JGB 10s30s: -58.59 bp; Daily US-minus-JGB: -54.10 bp; US 10s30s only: 59.00 bp
- Aug 18, 2026: US-minus-JGB 10s30s: -58.23 bp; Daily US-minus-JGB: -59.20 bp; US 10s30s only: 57.00 bp
- Aug 19, 2026: US-minus-JGB 10s30s: -58.51 bp; Daily US-minus-JGB: -62.00 bp; US 10s30s only: 54.00 bp
- Aug 20, 2026: US-minus-JGB 10s30s: -58.39 bp; Daily US-minus-JGB: -60.10 bp; US 10s30s only: 54.00 bp
- Aug 21, 2026: US-minus-JGB 10s30s: -58.53 bp; Daily US-minus-JGB: -63.00 bp; US 10s30s only: 53.00 bp
- Aug 24, 2026: US-minus-JGB 10s30s: -58.91 bp; Daily US-minus-JGB: -61.90 bp; US 10s30s only: 53.00 bp
- Aug 25, 2026: US-minus-JGB 10s30s: -58.92 bp; Daily US-minus-JGB: -61.30 bp; US 10s30s only: 53.00 bp
- Aug 26, 2026: US-minus-JGB 10s30s: -59.46 bp; Daily US-minus-JGB: -62.70 bp; US 10s30s only: 52.00 bp
- Aug 27, 2026: US-minus-JGB 10s30s: -60.18 bp; Daily US-minus-JGB: -62.10 bp; US 10s30s only: 52.00 bp
- Aug 28, 2026: US-minus-JGB 10s30s: -61.28 bp; Daily US-minus-JGB: -66.40 bp; US 10s30s only: 49.00 bp
- Aug 31, 2026: US-minus-JGB 10s30s: -62.36 bp; Daily US-minus-JGB: -64.90 bp; US 10s30s only: 50.00 bp
- Sep 1, 2026: US-minus-JGB 10s30s: -63.08 bp; Daily US-minus-JGB: -66.40 bp; US 10s30s only: 48.00 bp
- Sep 2, 2026: US-minus-JGB 10s30s: -63.24 bp; Daily US-minus-JGB: -63.60 bp; US 10s30s only: 48.00 bp
- Sep 3, 2026: US-minus-JGB 10s30s: -63.29 bp; Daily US-minus-JGB: -60.60 bp; US 10s30s only: 48.00 bp
- Sep 4, 2026: US-minus-JGB 10s30s: -62.94 bp; Daily US-minus-JGB: -59.50 bp; US 10s30s only: 46.00 bp
- Sep 8, 2026: US-minus-JGB 10s30s: -62.90 bp; Daily US-minus-JGB: -61.50 bp; US 10s30s only: 45.00 bp
- Sep 9, 2026: US-minus-JGB 10s30s: -62.92 bp; Daily US-minus-JGB: -61.50 bp; US 10s30s only: 45.00 bp
- Sep 10, 2026: US-minus-JGB 10s30s: -63.20 bp; Daily US-minus-JGB: -65.50 bp; US 10s30s only: 42.00 bp
- Sep 11, 2026: US-minus-JGB 10s30s: -63.46 bp; Daily US-minus-JGB: -64.70 bp; US 10s30s only: 39.00 bp
- Sep 14, 2026: US-minus-JGB 10s30s: -63.64 bp; Daily US-minus-JGB: -68.20 bp; US 10s30s only: 37.00 bp
- Sep 15, 2026: US-minus-JGB 10s30s: -64.33 bp; Daily US-minus-JGB: -71.80 bp; US 10s30s only: 36.00 bp
- Sep 16, 2026: US-minus-JGB 10s30s: -65.06 bp; Daily US-minus-JGB: -73.70 bp; US 10s30s only: 34.00 bp
- Sep 17, 2026: US-minus-JGB 10s30s: -65.74 bp; Daily US-minus-JGB: -70.40 bp; US 10s30s only: 35.00 bp
- Sep 18, 2026: US-minus-JGB 10s30s: -67.01 bp; Daily US-minus-JGB: -73.30 bp; US 10s30s only: 33.00 bp
- Sep 24, 2026: US-minus-JGB 10s30s: -68.58 bp; Daily US-minus-JGB: -75.20 bp; US 10s30s only: 29.00 bp
- Sep 25, 2026: US-minus-JGB 10s30s: -69.64 bp; Daily US-minus-JGB: -72.10 bp; US 10s30s only: 32.00 bp
- Sep 28, 2026: US-minus-JGB 10s30s: -70.69 bp; Daily US-minus-JGB: -72.00 bp; US 10s30s only: 32.00 bp
- Sep 29, 2026: US-minus-JGB 10s30s: -71.28 bp; Daily US-minus-JGB: -71.40 bp; US 10s30s only: 33.00 bp
- Sep 30, 2026: US-minus-JGB 10s30s: -71.72 bp; Daily US-minus-JGB: -69.10 bp; US 10s30s only: 35.00 bp
- Oct 1, 2026: US-minus-JGB 10s30s: -71.50 bp; Daily US-minus-JGB: -66.00 bp; US 10s30s only: 37.00 bp
- Oct 2, 2026: US-minus-JGB 10s30s: -71.33 bp; Daily US-minus-JGB: -70.10 bp; US 10s30s only: 35.00 bp
Event markers: full labels
- Aug 19, 2026: Buyback
Figure 2. Relative flattening measures the change in the US slope against Japan's. It can coexist with rising yields in both US maturities. The August 19 marker denotes the announcement, and the original November 4 endpoint is still pending.
The Fed also changed policy during these yield movements, making the comparison more difficult. On September 16, it unanimously raised the target range by 25bp to 3.75–4%.5 The original comparison specified a September 2 baseline and November 4 endpoint, with a 10bp flattening criterion that required the Fed to leave its policy target unchanged. That condition has already failed, and the hike confounds attribution. The interim 8.1bp movement remains below the criterion, but a comparison whose prerequisite has failed cannot validate the formal test or vindicate the original thesis.
The policy change is one limit on attribution. Japan also adds context, although differences in monetary policy, demand and hedging costs can move its curve differently from the US curve. The slope also leaves the term premium unisolated. Expectations of future purchases and dealers' constraints could affect the response, but the existing evidence cannot separate these effects into a signal-versus-flow explanation. Comparing eligible securities with neighboring ineligible issues could help account for common curve movement; that security-level check remains unperformed.
Treasury's purchases still show that debt management can change the securities investors hold. How much interest-rate exposure leaves the market depends on the financing mix, while monetary policy also changed during the observation period. As of October 8, the evidence establishes purchases and curve movement, leaving net duration and causality unresolved. It provides no basis for assured suppression of long-term yields or a current trade. Extending the observations through November 4 can complete the descriptive record, but it cannot restore the unchanged-policy comparison originally planned.
Sources and reproducibility
The public calculation package preserves the October 6 collection and reproduces the descriptive calculations from frozen inputs. The yield averages use those same inputs and ten-common-date windows. Its historical duration-based illustration remains reproducible arithmetic, but the normalization defect prevents its use as a defensible response-scale calculation here. Original FRED HTTP authentication remains unverified. The current publisher PDF supports the ATI figures, although its byte identity with the original July 2024 file remains unverified.
- U.S. Treasury, August 19, 2026, nominal long-end liquidity-support announcement. ↩
- Treasury securities buyback records, frozen October 6, 2026 collection; calculation claims and methods and source provenance, commit
106ca09e42ab5b70541aff0ca01014bdfbaa32c3. ↩ - Stephen Miran and Nouriel Roubini, ATI: Activist Treasury Issuance and the Tug-of-War Over Monetary Policy (July 2024), pp. 9–14, publisher PDF. ↩
- FRED DGS30 and DGS10, and Japan Ministry of Finance government-bond yields, frozen October 6, 2026 collection; frozen-input replay and provenance. ↩
- Federal Reserve, September 16, 2026, FOMC statement. ↩
Get new essays and research by email. Subscribe on Substack (opens in new tab)