USDA, the US Department of Agriculture, publishes official estimates of how much corn the US grows. Numbers like these give the basis for prices and speculation how future conditions might be like. In the case of corn, it goes mostly into products like animal feed and ethanol as well as exports, so crop size matters well beyond farms. Looking at how these numbers are put together, Crop Production reports yield, the bushels per harvested acre, and production, which is yield times harvested acres. The monthly WASDE then puts this into a balance sheet: supply minus use leaves ending stocks, also called carryout, the corn left when the season ends. Prices trade that leftover; the agricultural market the way it works today is extremely dependent on speculators. So traders and speculators move on every revision, which is where an August yield number starts to matter.
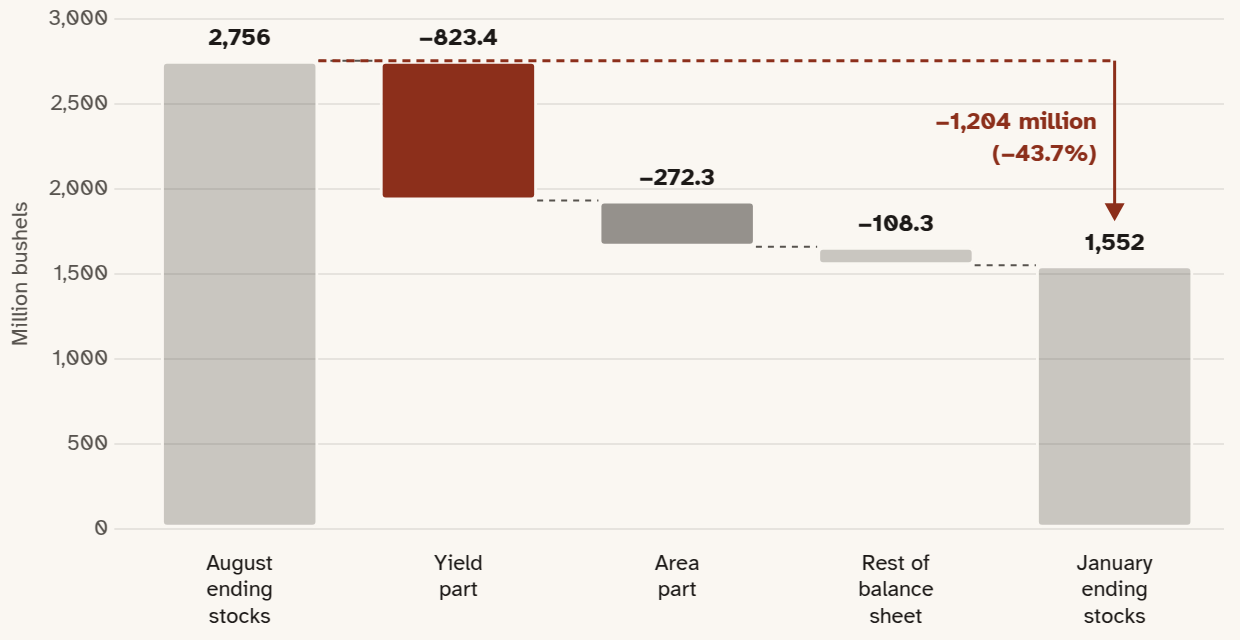
What happened in 2020, and why should a trader care? In August 2020 the USDA's estimates were much higher than the actual numbers collected in January. Yield went from 181.8 bushels per acre to 172.0. To put that change in context, the yield band is a range around the forecast. Now the interesting part in this story is that while the January yield still fell inside of our 80% yield band, it had a real impact that any trader should be interested in. Namely that the final was near its edge, outside the 50% yield band. That meant that production fell by 1,095.7 million bushels, of which yield accounted for 823.4 million bushels and area for 272.3, so January production fell outside even the 80% production band. Although the real number that should interest us is less the actual yield, but rather how much is left over at the end of the season. That's the actual number that matters on the exchange. USDA's projected ending stocks went from 2,756 million bushels in August to 1,552 in January, which removed 1,204 million bushels. And we saw in 2020 that while the estimate was just 5% off, the leftover was 44% less.
Market note · USDA August corn
2020: ending stocks fell from 2,756 to 1,552 million bushels
USDA’s August 2020 balance sheet against the January 2021 WASDE, million bushels. The production revision splits into a yield part and an area part; the rest of the balance sheet is the residual.
Source: USDA Crop Production and WASDE, August 2020 and January 2021; author’s calculations. Code and data: github.com/nik110403/usda-august-corn-misses.
All chart data
- August ending stocks: 2,756 million bushels
- Yield part: −823.4 million bushels
- Area part: −272.3 million bushels
- Rest of balance sheet: −108.3 million bushels
- January ending stocks: 1,552 million bushels
- Rest of the balance sheet is the residual: January ending stocks minus August ending stocks minus the yield part and the area part. Production revision −1,095.7 million bushels.
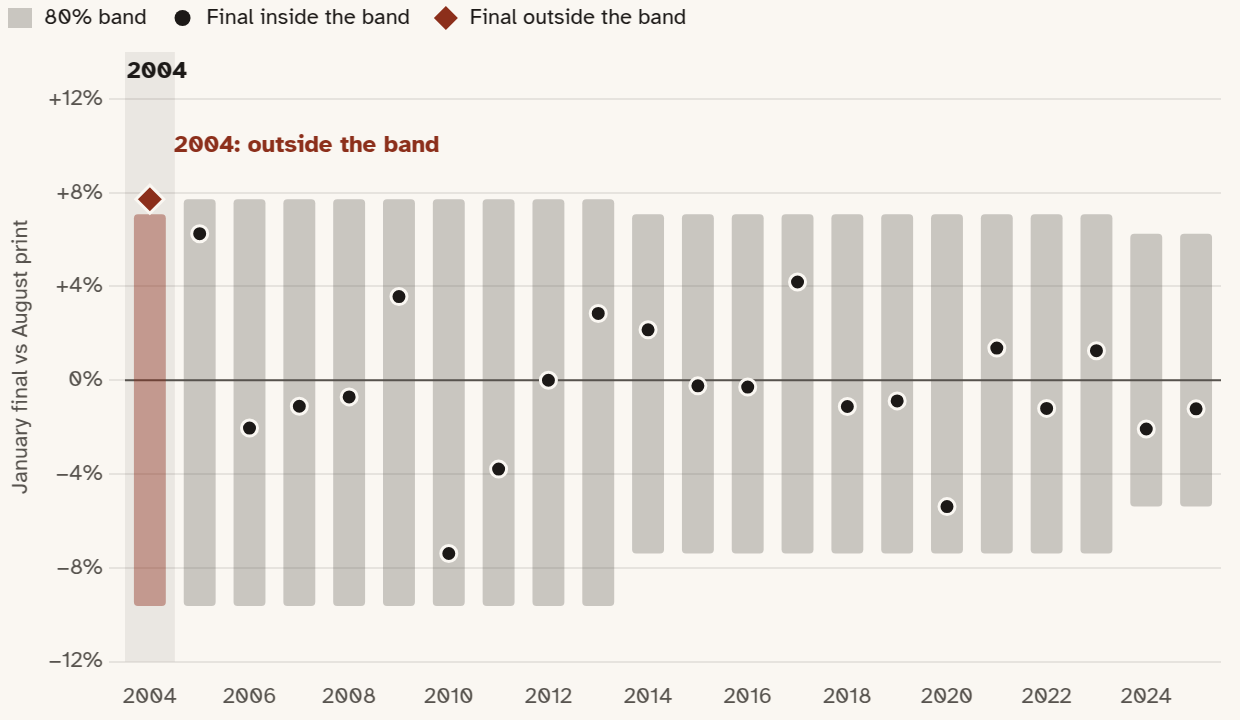
To understand why this is significant we need to look at how much the August numbers are usually off: Each August the USDA releases its estimate of how much corn will be harvested. The real numbers are usually fully realized and public by the following January. That is why the purpose of this project is to calculate how accurate USDA's yearly estimates are to see how much one can rely on these numbers. USDA's past August-to-January percent errors since 1995 set an 80% band, which is meant to catch the January final about four years in five. That band caught 21 out of the last 22 seasons (95.5%), a lot more than the 80% it aims for, so the pre-registered verdict was too wide. One reason being that we use too few data points to learn from, which by itself accounts for about 4 percentage points of the excess. The rest could also just be luck. The risk of these results is the use of too wide of a band, which makes the outcome look more uncertain than it really is.
The January final landed inside the 80% band in 21 of 22 seasons
Percent difference from USDA’s August yield print, 2004–2025. Each bar is the 80% band built from USDA’s past errors; the marker is where the January final landed.
Pre-registered verdict: too wide. About 4 points of the excess over 80% are expected from the estimator itself.
Source: USDA Crop Production, August print and January final, 2004–2025; author’s calculations. Code and data: github.com/nik110403/usda-august-corn-misses.
All chart data
- 2004: August print 148.9; 80% band 134.6 to 159.4 (outside); 50% band 143.9 to 154.6 (outside); January final 160.4 (+7.7% from the print)
- 2005: August print 139.2; 80% band 125.8 to 150.0 (inside); 50% band 134.5 to 149.1 (inside); January final 147.9 (+6.2% from the print)
- 2006: August print 152.2; 80% band 137.5 to 164.0 (inside); 50% band 151.2 to 161.7 (outside); January final 149.1 (−2.0% from the print)
- 2007: August print 152.8; 80% band 138.1 to 164.6 (inside); 50% band 149.7 to 162.3 (inside); January final 151.1 (−1.1% from the print)
- 2008: August print 155.0; 80% band 140.1 to 167.0 (inside); 50% band 151.8 to 164.7 (inside); January final 153.9 (−0.7% from the print)
- 2009: August print 159.5; 80% band 144.1 to 171.8 (inside); 50% band 156.3 to 169.5 (inside); January final 165.2 (+3.6% from the print)
- 2010: August print 165.0; 80% band 149.1 to 177.7 (inside); 50% band 163.2 to 171.3 (outside); January final 152.8 (−7.4% from the print)
- 2011: August print 153.0; 80% band 138.3 to 164.8 (inside); 50% band 149.9 to 158.9 (outside); January final 147.2 (−3.8% from the print)
- 2012: August print 123.4; 80% band 111.5 to 132.9 (inside); 50% band 119.2 to 128.1 (inside); January final 123.4 (0.0% from the print)
- 2013: August print 154.4; 80% band 139.5 to 166.3 (inside); 50% band 149.2 to 160.3 (inside); January final 158.8 (+2.9% from the print)
- 2014: August print 167.4; 80% band 155.0 to 179.2 (inside); 50% band 164.0 to 173.4 (inside); January final 171.0 (+2.1% from the print)
- 2015: August print 168.8; 80% band 156.3 to 180.7 (inside); 50% band 165.4 to 174.8 (inside); January final 168.4 (−0.2% from the print)
- 2016: August print 175.1; 80% band 162.2 to 187.5 (inside); 50% band 171.5 to 181.4 (inside); January final 174.6 (−0.3% from the print)
- 2017: August print 169.5; 80% band 157.0 to 181.5 (inside); 50% band 166.0 to 175.6 (outside); January final 176.6 (+4.2% from the print)
- 2018: August print 178.4; 80% band 165.2 to 191.0 (inside); 50% band 176.4 to 184.8 (outside); January final 176.4 (−1.1% from the print)
- 2019: August print 169.5; 80% band 157.0 to 181.5 (inside); 50% band 167.6 to 175.6 (inside); January final 168.0 (−0.9% from the print)
- 2020: August print 181.8; 80% band 168.4 to 194.7 (inside); 50% band 179.8 to 188.3 (outside); January final 172.0 (−5.4% from the print)
- 2021: August print 174.6; 80% band 161.7 to 187.0 (inside); 50% band 171.0 to 180.8 (inside); January final 177.0 (+1.4% from the print)
- 2022: August print 175.4; 80% band 162.4 to 187.8 (inside); 50% band 173.4 to 181.3 (outside); January final 173.3 (−1.2% from the print)
- 2023: August print 175.1; 80% band 162.2 to 187.5 (inside); 50% band 173.0 to 181.0 (inside); January final 177.3 (+1.3% from the print)
- 2024: August print 183.1; 80% band 173.2 to 194.5 (inside); 50% band 180.9 to 189.3 (outside); January final 179.3 (−2.1% from the print)
- 2025: August print 188.8; 80% band 178.6 to 200.6 (inside); 50% band 185.0 to 195.2 (inside); January final 186.5 (−1.2% from the print)
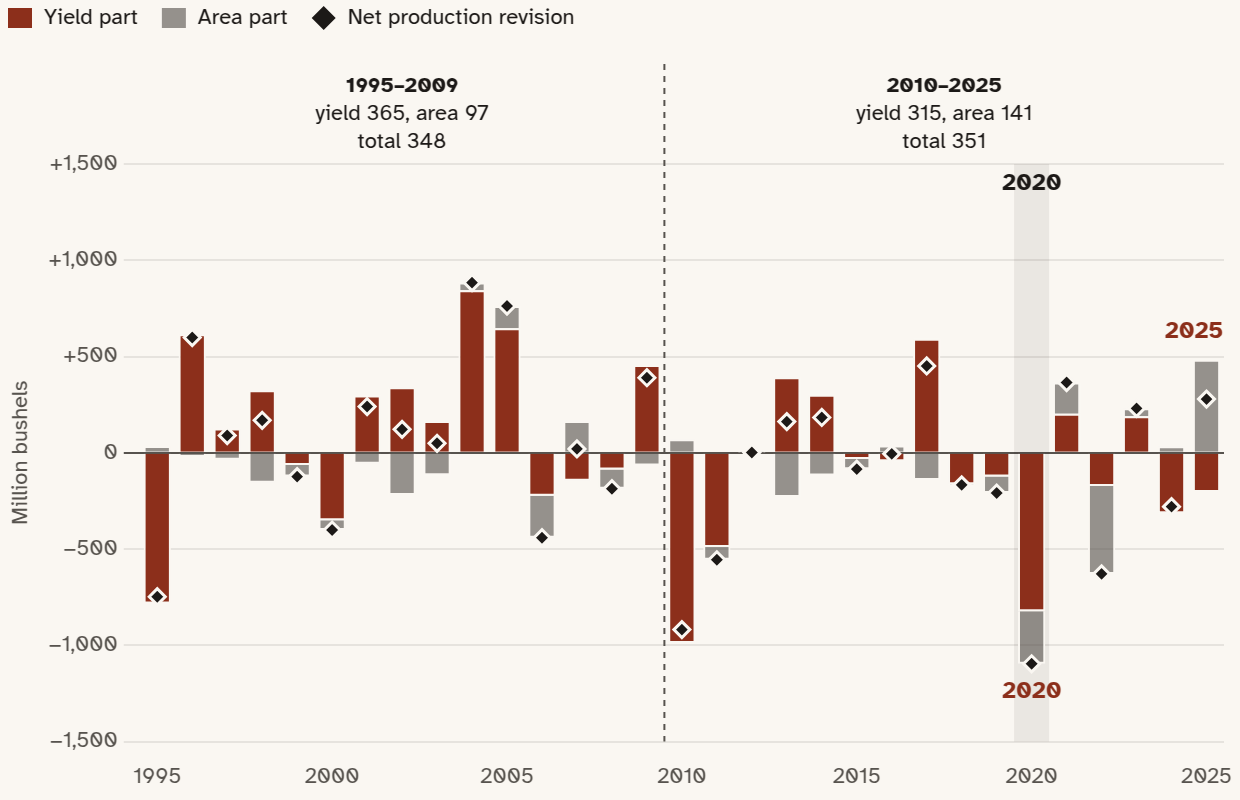
If the August yield got more accurate, did the risk to the balance sheet go away? The biggest errors made by the USDA in the past are old, and since then most of their estimates have come rather close. But at the same time their estimates for how many acres of corn are harvested have moved in the opposite direction. That matters because we calculate production by multiplying yield and acres, so if one gets more accurate and the other less, the overall revisions stay about the same, on average 348 million bushels for 1995 to 2009 and 351 million for 2010 to 2025, on a much bigger crop. This split is exploratory and was only described after the fact. For example, you can see this in 2025. Namely that while the yield decreases, the overall crop actually increased. This is due to the sum of acres that were harvested was much higher than the USDA expected. Ending stocks were also revised by +110 million bushels (5.2%).
Exploratory, described after the fact
Yield revisions shrank, area revisions grew, the total stayed near 350 million bushels
Revision from USDA’s first August production print to the January final, by season. Mean absolute values, million bushels, 1995–2009 against 2010–2025.
Source: USDA Crop Production and WASDE, 1995–2025; author’s calculations. Code and data: github.com/nik110403/usda-august-corn-misses.
All chart data
- 1995: yield part −782.7, area part 35.0, net −747.6 million bushels
- 1996: yield part 615.5, area part −16.7, net 598.8 million bushels
- 1997: yield part 125.9, area part −36.2, net 89.7 million bushels
- 1998: yield part 324.7, area part −155.7, net 169.0 million bushels
- 1999: yield part −63.9, area part −59.7, net −123.6 million bushels
- 2000: yield part −350.7, area part −50.3, net −401.0 million bushels
- 2001: yield part 297.5, area part −57.1, net 240.4 million bushels
- 2002: yield part 340.8, area part −219.2, net 121.7 million bushels
- 2003: yield part 165.4, area part −116.0, net 49.4 million bushels
- 2004: yield part 843.8, area part 40.3, net 884.1 million bushels
- 2005: yield part 647.0, area part 115.2, net 762.2 million bushels
- 2006: yield part −223.5, area part −217.4, net −440.9 million bushels
- 2007: yield part −145.2, area part 165.5, net 20.3 million bushels
- 2008: yield part −87.2, area part −99.4, net −186.6 million bushels
- 2009: yield part 456.0, area part −66.0, net 390.1 million bushels
- 2010: yield part −988.3, area part 69.9, net −918.4 million bushels
- 2011: yield part −489.5, area part −66.2, net −555.7 million bushels
- 2012: yield part 0.0, area part 1.7, net 1.7 million bushels
- 2013: yield part 392.2, area part −230.1, net 162.1 million bushels
- 2014: yield part 301.8, area part −118.2, net 183.6 million bushels
- 2015: yield part −32.4, area part −52.4, net −84.9 million bushels
- 2016: yield part −43.3, area part 37.8, net −5.4 million bushels
- 2017: yield part 592.8, area part −141.7, net 451.1 million bushels
- 2018: yield part −163.5, area part −2.8, net −166.4 million bushels
- 2019: yield part −123.0, area part −86.1, net −209.1 million bushels
- 2020: yield part −823.4, area part −272.3, net −1,095.7 million bushels
- 2021: yield part 202.8, area part 162.0, net 364.8 million bushels
- 2022: yield part −171.9, area part −457.1, net −629.0 million bushels
- 2023: yield part 189.9, area part 40.9, net 230.8 million bushels
- 2024: yield part −314.3, area part 34.5, net −279.8 million bushels
- 2025: yield part −204.0, area part 482.9, net 278.9 million bushels
Exploratory
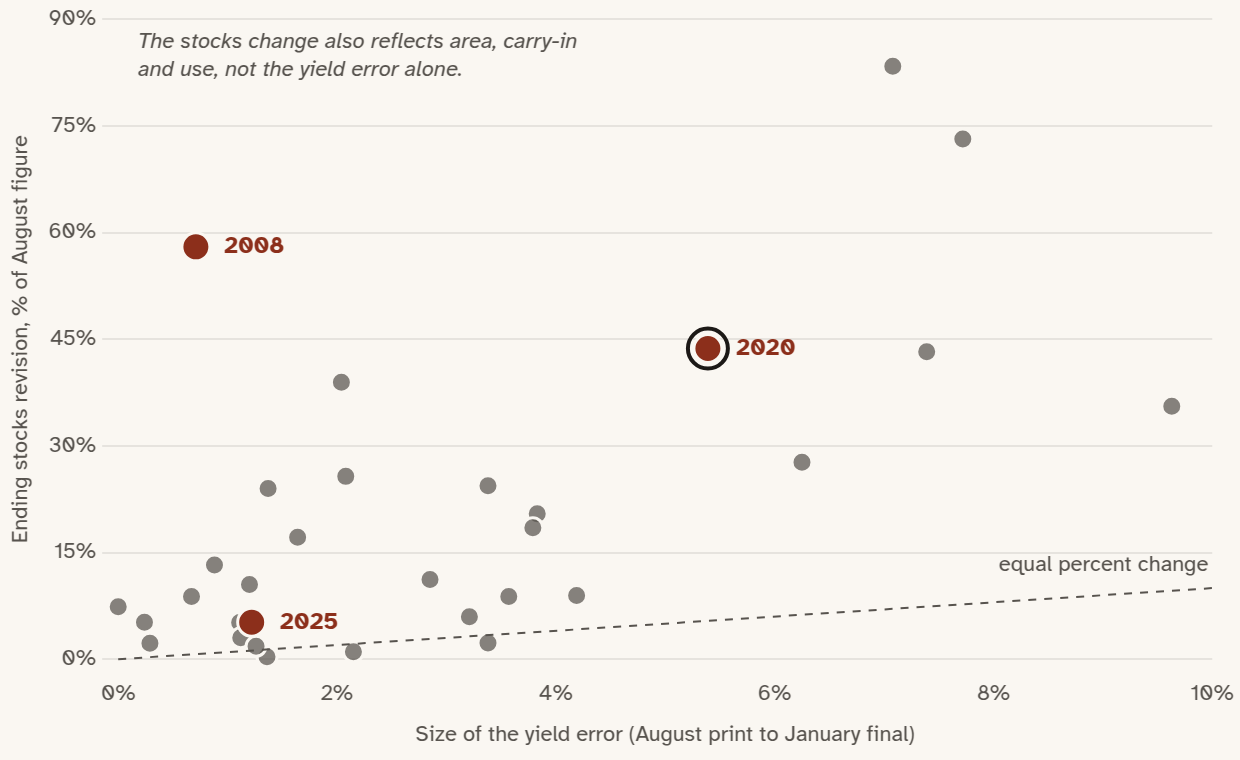
Ending stocks moved by a larger percentage than the yield error in 28 of 31 seasons
One point per season, 1995–2025. Horizontal: size of the yield error. Vertical: size of the ending stocks revision from August to January, as a share of August ending stocks.
Source: USDA Crop Production and WASDE, 1995–2025; author’s calculations. Code and data: github.com/nik110403/usda-august-corn-misses.
All chart data
- 1995: yield error −9.6%; ending stocks −35.6% of the August figure (−280 million bushels)
- 1996: yield error +7.1%; ending stocks +83.4% of the August figure (+436 million bushels)
- 1997: yield error +1.4%; ending stocks −0.3% of the August figure (−3 million bushels)
- 1998: yield error +3.4%; ending stocks −2.3% of the August figure (−42 million bushels)
- 1999: yield error −0.7%; ending stocks −8.8% of the August figure (−166 million bushels)
- 2000: yield error −3.4%; ending stocks −24.4% of the August figure (−583 million bushels)
- 2001: yield error +3.2%; ending stocks +6.0% of the August figure (+87 million bushels)
- 2002: yield error +3.8%; ending stocks +20.5% of the August figure (+157 million bushels)
- 2003: yield error +1.6%; ending stocks −17.1% of the August figure (−203 million bushels)
- 2004: yield error +7.7%; ending stocks +73.1% of the August figure (+828 million bushels)
- 2005: yield error +6.2%; ending stocks +27.7% of the August figure (+526 million bushels)
- 2006: yield error −2.0%; ending stocks −39.0% of the August figure (−480 million bushels)
- 2007: yield error −1.1%; ending stocks −5.2% of the August figure (−78 million bushels)
- 2008: yield error −0.7%; ending stocks +58.0% of the August figure (+657 million bushels)
- 2009: yield error +3.6%; ending stocks +8.8% of the August figure (+143 million bushels)
- 2010: yield error −7.4%; ending stocks −43.2% of the August figure (−567 million bushels)
- 2011: yield error −3.8%; ending stocks +18.5% of the August figure (+132 million bushels)
- 2012: yield error 0.0%; ending stocks −7.4% of the August figure (−48 million bushels)
- 2013: yield error +2.9%; ending stocks −11.2% of the August figure (−206 million bushels)
- 2014: yield error +2.1%; ending stocks +1.1% of the August figure (+19 million bushels)
- 2015: yield error −0.2%; ending stocks +5.2% of the August figure (+89 million bushels)
- 2016: yield error −0.3%; ending stocks −2.2% of the August figure (−54 million bushels)
- 2017: yield error +4.2%; ending stocks +9.0% of the August figure (+204 million bushels)
- 2018: yield error −1.1%; ending stocks +3.0% of the August figure (+51 million bushels)
- 2019: yield error −0.9%; ending stocks −13.2% of the August figure (−289 million bushels)
- 2020: yield error −5.4%; ending stocks −43.7% of the August figure (−1,204 million bushels)
- 2021: yield error +1.4%; ending stocks +24.0% of the August figure (+298 million bushels)
- 2022: yield error −1.2%; ending stocks −10.5% of the August figure (−146 million bushels)
- 2023: yield error +1.3%; ending stocks −1.8% of the August figure (−40 million bushels)
- 2024: yield error −2.1%; ending stocks −25.7% of the August figure (−533 million bushels)
- 2025: yield error −1.2%; ending stocks +5.2% of the August figure (+110 million bushels)
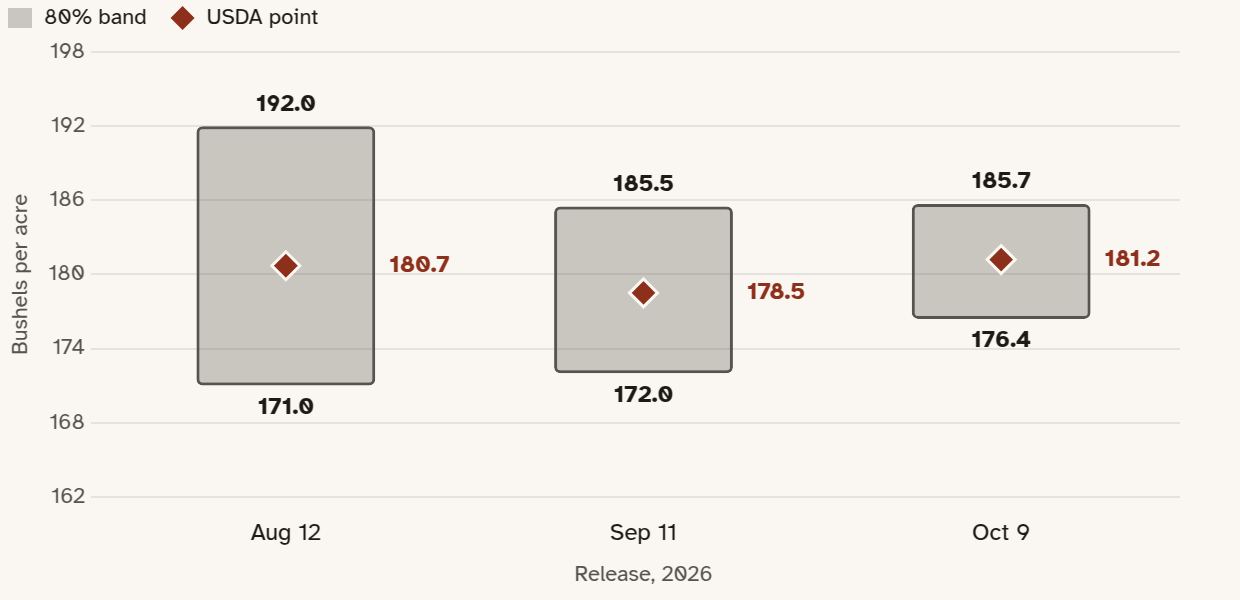
To see what this means, for 2025 we put both production bounds into USDA's August 2025 balance sheet for 2025/26, holding use fixed, so this part is not scored. The result is stocks-to-use, which is ending stocks as a percentage of total use. Using this methodology we get a range around 6 to 20% which still covers USDA's 13.3%. On the lower end we would see a tighter market that could mean higher prices, while the upper end could mean more of a cushion, with USDA being at the middle of it. For this year, in October 2026, USDA's 181.2 bushels per acre sits within an 80% band of 176.4 to 185.7, built around it. But we cannot judge an 80% band from one January. About one season in five should fall outside, so we look at 21 of 22 for the August band (pre-registered test) and 17 of 20 for this October band (exploratory). So checking this 2026 band against the January 2027 numbers would mean checking our math.
The 80% band for 2026 narrowed from 21.0 to 9.3 bushels per acre by October
USDA’s point and the 80% band at each 2026 release, built with the same method as the 2004–2025 test.
Forecast only, unscored. Settles against the January 2027 Crop Production Annual Summary.
Source: USDA Crop Production, 2026 releases; author’s calculations. Code and data: github.com/nik110403/usda-august-corn-misses.
All chart data
- Aug 12, 2026: USDA point 180.7 bu/ac; 80% band 171.0 to 192.0 (width 21.0)
- Sep 11, 2026: USDA point 178.5 bu/ac; 80% band 172.0 to 185.5 (width 13.5)
- Oct 9, 2026: USDA point 181.2 bu/ac; 80% band 176.4 to 185.7 (width 9.3)
The USDA reports WASDE, Crop Production and Crop Progress carry release timestamps, and a guard, a check in the code, blocks values released after the forecast date. Those rules were set before the test and can be replicated with the public data pipeline and code. But we had replicated the Good–Irwin August versus final table first, so we roughly knew how forecasts behaved.
Background. Others have studied USDA’s forecasts in far more depth. Isengildina-Massa, Irwin and Good (2009) built intervals from past errors for WASDE price forecasts. Irwin, Good and Sanders (2014) tracked USDA’s corn yield errors over time. Isengildina-Massa, Karali and Irwin (2020) compared USDA with the average private forecast through 2019: USDA appeared to regain an edge on August corn production from the mid-2000s, though the 2002-2019 gap was not statistically significant. Specialist analysts and large grain merchants such as ADM, Bunge, Cargill and Louis Dreyfus follow these numbers closely. The main limit is that I score USDA against January, not against the pre-report average that desks trade.
Code and data · Desk memo (PDF)
Read the full paper (PDF, opens in new tab)
Get new essays and research by email. Subscribe on Substack (opens in new tab)